Grafana Agent Kubernetes Operator

Grafana stack (LTM) provides an integrated observability solution for your platform.
As per Grafana website :
“Loki is a horizontally scalable, highly available, multi-tenant log aggregation system inspired by Prometheus. It is designed to be very cost effective and easy to operate. It does not index the contents of the logs, but rather a set of labels for each log stream.”
“Mimir is an open source, horizontally scalable, highly available, multi-tenant, long-term storage for Prometheus.”
“Grafana Tempo is an open source, easy-to-use, and high-scale distributed tracing backend. Tempo is cost-efficient, requiring only object storage to operate. Tempo can ingest common open source tracing protocols, including Jaeger, Zipkin, and OpenTelemetry.”
Grafana Agent is a batteries-included, open source telemetry collector for collecting metrics, logs, and traces.
Each of the above (Loki, Mimir, and Tempo) can be deployed in various modes depending upon the scale, speed, security, and spend requirements.
Specifically for kubernetes platform, grafana agent is deployed with multiple config files, namely server config, metrics config, log_config, traces_config, dynamic_config, integration_config.
The management of these config can be done by
- Mounting the grafana agent config yaml as secrets/configmap mounted on grafana-agent pod
- Running agent in scraping service mode and using the config management api (https://grafana.com/docs/agent/latest/api/)
There are drawbacks to the above approach. Defining configs as Kubernetes secrets or configmaps could be error-prone as there are no validations in place. This would result in the pod failing to start to find out if the configuration is invalid.
Exposing agent configuration API outside of cluster would require addiontinal security measures to ensure it used properly.
Another approach could be
Define all config in the form of first class kubernetes CRDs with proper validation and have an operator “observe” the changes in the deployed instances of these CRDs and make relevant changes in the agent config.
Kubernetes operator ( which utilizes above approach in general) short intro below for readers who are not aware
A Kubernetes operator is a method of packaging, deploying, and managing a Kubernetes application. A Kubernetes application is both deployed on Kubernetes and managed using the Kubernetes API (application programming interface) and kubectl tooling
Grafana Agent Operator could be useful if the above approach is acceptable for your use case.
Let’s look at an example of how an operator works in a single cluster setup.
I will be using Pulumi to deploy the helm chart for the operator on the cluster.
def create_grafana_operator(cluster_provider):
    charts = k8s.helm.v3.Chart("grafana-agent",
                     k8s.helm.v3.ChartOpts(chart="grafana-agent-operator",
                     namespace="default",
                     version="0.2.12",
                     fetch_opts=k8s.helm.v3.FetchOpts(
                     repo="https://grafana.github.io/helm-charts"
                 )
        ),
 opts=pulumi.ResourceOptions(provider=cluster_provider))
above function deploys the grafana operator on your cluster. (cluster_ provider is the callback output of the pulumi cluster create command)
The below resources are installed on the cluster
     ├─ eks:index:Cluster                                               my-cluster
     │  └─ aws:eks:Cluster                                              my-cluster-eksCluster
 +   └─ kubernetes:helm.sh/v3:Chart                                     grafana-agent                                 created (35s)
 +      ├─ kubernetes:apiextensions.k8s.io/v1:CustomResourceDefinition  podmonitors.monitoring.coreos.com             created (1s)
 +      ├─ kubernetes:rbac.authorization.k8s.io/v1:ClusterRoleBinding   grafana-agent-grafana-agent-operator          created (2s)
 +      ├─ kubernetes:rbac.authorization.k8s.io/v1:ClusterRole          grafana-agent-grafana-agent-operator          created (2s)
 +      ├─ kubernetes:apiextensions.k8s.io/v1:CustomResourceDefinition  servicemonitors.monitoring.coreos.com         created (3s)
 +      ├─ kubernetes:apiextensions.k8s.io/v1:CustomResourceDefinition  logsinstances.monitoring.grafana.com          created (5s)
 +      ├─ kubernetes:apiextensions.k8s.io/v1:CustomResourceDefinition  probes.monitoring.coreos.com                  created (5s)
 +      ├─ kubernetes:apiextensions.k8s.io/v1:CustomResourceDefinition  podlogs.monitoring.grafana.com                created (5s)
 +      ├─ kubernetes:apiextensions.k8s.io/v1:CustomResourceDefinition  metricsinstances.monitoring.grafana.com       created (6s)
 +      ├─ kubernetes:apiextensions.k8s.io/v1:CustomResourceDefinition  integrations.monitoring.grafana.com           created (6s)
 +      ├─ kubernetes:apiextensions.k8s.io/v1:CustomResourceDefinition  grafanaagents.monitoring.grafana.com          created (8s)
 +      ├─ kubernetes:core/v1:ServiceAccount                            default/grafana-agent-grafana-agent-operator  created (7s)
 +      └─ kubernetes:apps/v1:Deployment                                default/grafana-agent-grafana-agent-operator  created (17s)
The most important of these is grafanaagents.monitoring.grafana.com. An instance of this CRD will provide blueprints to the Grafna agent operator for creating a Grafna agent pod instance. The grafana agent pod is lazily initialized. Unless we create a source-sink configuration instance, the agent pod is not created.
For more details on grafana agent operator CRDs specs refer below link
https://grafana.com/docs/agent/latest/operator/api/
Post the heml install you will see the grafana agent operator deployment installed and operator pod initialized
grafana-agent-grafana-agent-operator-655d8d4599-zkw9c 1/1 Running 0 139mLet us define instance of grafanaagents.monitoring.grafana.com CRD.We will also define accompanying service account, role, binding
apiVersion: v1
kind: ServiceAccount
metadata:
  name: grafana-agent
  namespace: default
---
apiVersion: rbac.authorization.k8s.io/v1
kind: ClusterRole
metadata:
  name: grafana-agent
rules:
  - apiGroups:
      - ""
    resources:
      - nodes
      - nodes/proxy
      - nodes/metrics
      - services
      - endpoints
      - pods
      - events
    verbs:
      - get
      - list
      - watch
  - apiGroups:
      - networking.k8s.io
    resources:
      - ingresses
    verbs:
      - get
      - list
      - watch
  - nonResourceURLs:
      - /metrics
      - /metrics/cadvisor
    verbs:
      - get
---
apiVersion: rbac.authorization.k8s.io/v1
kind: ClusterRoleBinding
metadata:
  name: grafana-agent
roleRef:
  apiGroup: rbac.authorization.k8s.io
  kind: ClusterRole
  name: grafana-agent
subjects:
  - kind: ServiceAccount
    name: grafana-agent
    namespace: default
---
apiVersion: monitoring.grafana.com/v1alpha1
kind: GrafanaAgent
metadata:
  name: grafana-agent
  namespace: default
spec:
  image: grafana/agent:v0.26.1
  integrations: # for integration source this label will matched to identify sink
    selector:
      matchLabels:
        agent: grafana-agent
  metrics:
    externalLabels:
      cluster: my-cluster
    instanceSelector: # for metrics source config this will matched to identify sink
      matchLabels:
        agent: grafana-agent
    scrapeInterval: 60s
  serviceAccountName: grafana-agent
Once the above definition is applied, basically no changes happen. Just the definition is installed.
Now lets create a scraping source-sink instance. For this, we will first create a small kafka cluster and then use the jmx port of the kafka instance as metrics source
def create_kafka(cluster_provider):
    namespace = k8s.core.v1.Namespace(
        "kafka",
        metadata={
            "name": "kafka"
        },
        opts=pulumi.ResourceOptions(provider=cluster_provider)
    )

    charts = k8s.helm.v3.Chart("kafka",
                               k8s.helm.v3.ChartOpts(chart="kafka",
               namespace=namespace.metadata["name"],
               version="20.0.0",
               fetch_opts=k8s.helm.v3.FetchOpts(
                 repo="https://charts.bitnami.com/bitnami"
               ),
               values=kafka_values
     ),
    opts=pulumi.ResourceOptions(provider=cluster_provider))
NAME READY STATUS RESTARTS AGE
kafka-0 2/2 Running 0 168m
kafka-1 2/2 Running 0 168m
kafka-zookeeper-0 1/1 Running 0 169m
kafka-jmx-metrics ClusterIP 172.20.113.137 <none> 5556/TCP 173mWe have exposed the kafka jmx metrics via a ClusterIP service, from where we will scrape the metrics.
Now we need to define a MetricsInstance to define the sink for the metrics, Once this is defined the operator will create an instance of grafana-agent.
apiVersion: monitoring.grafana.com/v1alpha1
kind: MetricsInstance
metadata:
  labels:
    agent: grafana-agent  ## should be same as the instance selector/name
  name: metrics-instance
  namespace: default
spec:
  additionalScrapeConfigs: # this is optional used for few cases
    name: kafka-metrics
    key: kafkaConfig
  remoteWrite:
    - url: <source_url>/api/v1/push # sink url
  serviceMonitorNamespaceSelector: {} ## for all namespaces
  serviceMonitorSelector:
    matchLabels:
      instance: primary  ## label to match in sevice monitors etc.
now you can see the grafana-agent pod initialized
grafana-agent-0                                                   2/2     Running     0          6h52m
grafana-agent-grafana-agent-operator-7db5bfbb66-w2pmg             1/1     Running     0          6h52m
Once the sink is defined, we need to define the scraping source. This can be done by two ways.
- AdditionalScrapeConfig ( for edge case handling)
Notice the additionalScrapeConfigs can contain the addiontinal custom scarping config. You can define a secret with the custom scarping config in the Grafana agent config format
apiVersion: v1
kind: Secret
metadata:
  name: kafka-metrics
  namespace: default
stringData:
  kafkaConfig: |
    - job_name: integrations/kafka
      scrape_interval: 60s
      static_configs:
      - targets:
        - kafka-jmx-metrics.kafka.svc.cluster.local:5556
      scheme: http
The secret MUST be in the same namespace as the MetricsInstance.
There is a known issue in this approach, that currently prevents the Grafana Agent Operator from updating Grafana Agent deployments when additionalScrapeConfigs or the underlying secret changes. Until the issue is resolved, you should restart the Operator to force it to pick up the changes.
2. Service Monitor on kube kafka-jmx-metrics svc
ServiceMonitor CRD to define a scraping source
apiVersion: monitoring.coreos.com/v1
kind: ServiceMonitor
metadata:
  name: kafka-jmx-monitor
  namespace: kafka
  labels:
    app: kafka-jmx-monitor
    instance: primary
spec:
  selector:
    matchLabels:
      app.kubernetes.io/name: kafka
  namespaceSelector:
    matchNames:
      - kafka
  endpoints:
  - port: http-metrics  # port name for the kafka-jmx-metrics
    interval: 30s
    path: /
    scheme: http
    honorLabels: true
In this approach you don’t need to manual do anything, grafana agent operator observes any newly added metrics instance and configures them.
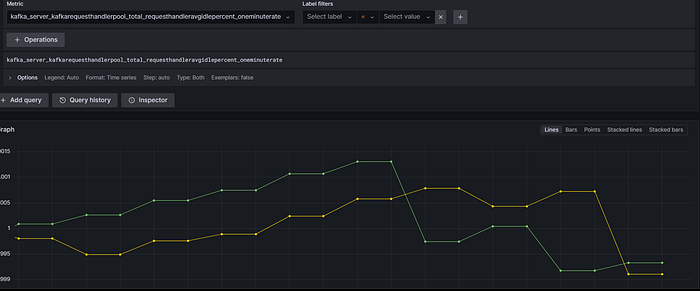
Now you can see the metrics on the grafana cloud instance or local grafana instance by adding data source for promethues.
Similar to above you can add logging sink source and tracing setup.
Follow me on more stuff for observability.
